China Employer Cost by City: 2026 Benchmark for 38 Cities
By Out2China · Last updated 19 November 2026 · Policy month: October 2026
China employer cost: 38 cities compared
Quick answer. Employer cost in China varies by city. For an employee on a gross salary of RMB 15,000 a month, we estimate that statutory contributions add between 25.5% and 32.2% on top of salary across 38 cities. That is with the housing fund at the 5% minimum; at each city's maximum rate the range is 32.5% to 39.2%. For senior salaries the gap between cities widens, because contribution caps differ.
29.9%
Median employer load at RMB 15,000, across 38 cities
6.7 pts
Gap between the highest and lowest city at RMB 15,000
10.1 pts
Gap at RMB 50,000, where caps differ most
81%
Share of gross pay an employee takes home at RMB 15,000
Employer load by city
At RMB 15,000 the employer load runs from 25.5% in Foshan to 32.2% in Tianjin. The chart shows employer social insurance and housing fund as a percentage of gross monthly salary. Choose a salary level.
Tianjin32.2%
Chongqing31.8%
Beijing31.5%
Shaoxing31.5%
Hangzhou31.2%
Zhengzhou31.1%
Dalian31.1%
Changsha31.0%
Wenzhou30.9%
Shanghai30.7%
Jiaxing30.7%
Wuhan30.6%
Yiwu30.4%
Shenyang30.3%
Kunming30.3%
Ningbo30.2%
Chengdu30.1%
Xiamen30.1%
Qingdao29.9%
Jinan29.9%
Yantai29.9%
Weihai29.9%
Weifang29.9%
Wuxi29.7%
Fuzhou29.7%
Shenzhen29.5%
Suzhou29.5%
Nanjing29.5%
Xi’an28.9%
Guangzhou28.9%
Haikou28.3%
Dongguan28.2%
Hefei28.1%
Jiangmen28.0%
Zhuhai28.0%
Zhongshan27.8%
Huizhou27.6%
Foshan25.5%
Key findings
The rule of thumb is about 30%, with the housing fund at 5%. Across 38 cities the median employer load at RMB 15,000 is 29.9% (36.9% at each city's maximum housing fund rate). Tianjin is highest at 32.2% and Foshan lowest at 25.5%; both figures rest on assumptions set out under Method.
City choice changes the bill by under seven points at mid-level salaries. For a RMB 15,000 employee the gap between the most and least expensive city is 6.7 points, or about RMB 11,980 a year. Without Foshan, which sits well below the other cities, the spread is 4.6 points.
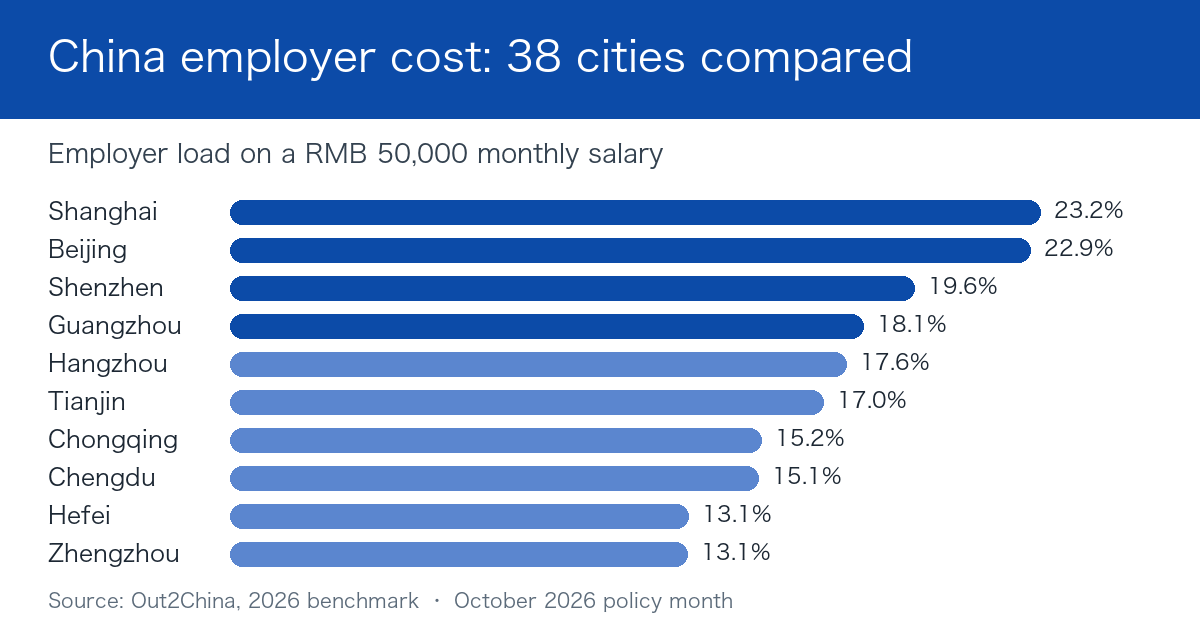
The gap widens for senior hires. At RMB 50,000 the load runs from 13.1% in Zhengzhou and Hefei to 23.2% in Shanghai, because contribution bases are capped and the caps differ by city. Over a year that is a difference of about RMB 60,000 for one employee.
Beijing and Shanghai are the only two cities where a RMB 30,000 salary is still charged at the full rate. In the other 36 cities the cap has already started to reduce the load at that level. In Hefei and Zhengzhou it is down to 21.8%.
Guangdong's manufacturing cities are among the cheapest. At RMB 15,000 Foshan is lowest at 25.5%. Huizhou, Zhongshan, Zhuhai, Jiangmen and Dongguan sit between 27.6% and 28.2%. Hefei, at 28.1%, is the only city outside Guangdong in that range.
At RMB 15,000, the housing fund rate matters more than the city. Moving from the 5% minimum to a 12% rate adds seven points in every city where 12% is allowed, against a 6.7-point spread between cities (4.6 without Foshan). Shanghai's maximum in this model is 7%.
Employees keep about 81% of gross. At RMB 15,000, take-home pay after employee contributions and estimated income tax is between RMB 12,097 and RMB 12,254 in every city.
Full table
For 37 of the 38 cities these are reference estimates, not confirmed against the current official notice. Housing fund at 5% unless stated. Ranked by load at RMB 15,000.
#
City
RMB 8,000
RMB 15,000
RMB 30,000
RMB 50,000
Total employer cost at RMB 15,000
At the city's maximum housing fund rate (RMB 15,000)
Take-home at RMB 15,000
1
Tianjin
32.2%
32.2%
28.3%
17.0%
RMB 19,830
39.2% (at 12%)
RMB 12,118
2
Chongqing
31.8%
31.8%
25.3%
15.2%
RMB 19,770
38.8% (at 12%)
RMB 12,118
3
Beijing
31.5%
31.5%
31.5%
22.9%
RMB 19,725
38.5% (at 12%)
RMB 12,115
4
Shaoxing
31.5%
31.5%
27.6%
16.8%
RMB 19,725
38.5% (at 12%)
RMB 12,253
5
Hangzhou
31.2%
31.2%
27.4%
17.6%
RMB 19,680
38.2% (at 12%)
RMB 12,118
6
Zhengzhou
31.1%
31.1%
21.8%
13.1%
RMB 19,665
38.1% (at 12%)
RMB 12,145
7
Dalian
31.1%
31.1%
25.3%
15.4%
RMB 19,665
38.1% (at 12%)
RMB 12,104
8
Changsha
31.0%
31.0%
25.5%
19.1%
RMB 19,650
38.0% (at 12%)
RMB 12,145
9
Wenzhou
30.9%
30.9%
28.5%
21.1%
RMB 19,635
37.9% (at 12%)
RMB 12,118
10
Shanghai
30.7%
30.7%
30.7%
23.2%
RMB 19,605
32.7% (at 7%)
RMB 12,118
11
Jiaxing
30.7%
30.7%
26.9%
16.7%
RMB 19,605
37.7% (at 12%)
RMB 12,118
12
Wuhan
30.6%
30.6%
24.4%
15.3%
RMB 19,590
37.6% (at 12%)
RMB 12,138
13
Yiwu
30.4%
30.4%
26.7%
16.2%
RMB 19,560
37.4% (at 12%)
RMB 12,118
14
Shenyang
30.3%
30.3%
24.5%
14.8%
RMB 19,545
37.3% (at 12%)
RMB 12,118
15
Kunming
30.6%
30.3%
23.5%
14.4%
RMB 19,544
37.3% (at 12%)
RMB 12,144
16
Ningbo
30.2%
30.2%
26.5%
16.8%
RMB 19,530
37.2% (at 12%)
RMB 12,118
17
Chengdu
30.1%
30.1%
24.7%
15.1%
RMB 19,521
37.1% (at 12%)
RMB 12,131
18
Xiamen
30.1%
30.1%
24.2%
14.8%
RMB 19,515
37.1% (at 12%)
RMB 12,118
19
Qingdao
29.9%
29.9%
25.8%
19.1%
RMB 19,479
36.9% (at 12%)
RMB 12,145
20
Jinan
29.9%
29.9%
25.8%
19.1%
RMB 19,479
36.9% (at 12%)
RMB 12,145
21
Yantai
29.9%
29.9%
25.4%
18.4%
RMB 19,479
36.9% (at 12%)
RMB 12,145
22
Weihai
29.9%
29.9%
25.0%
18.2%
RMB 19,479
36.9% (at 12%)
RMB 12,145
23
Weifang
29.9%
29.9%
22.9%
13.8%
RMB 19,479
36.9% (at 12%)
RMB 12,145
24
Wuxi
29.7%
29.7%
25.7%
16.1%
RMB 19,455
36.7% (at 12%)
RMB 12,118
25
Fuzhou
29.7%
29.7%
25.7%
18.9%
RMB 19,455
36.7% (at 12%)
RMB 12,118
26
Shenzhen
29.5%
29.5%
28.1%
19.6%
RMB 19,425
36.5% (at 12%)
RMB 12,158
27
Suzhou
29.5%
29.5%
25.5%
16.4%
RMB 19,425
36.5% (at 12%)
RMB 12,113
28
Nanjing
29.5%
29.5%
25.5%
16.6%
RMB 19,425
36.5% (at 12%)
RMB 12,109
29
Xi’an
29.0%
28.9%
25.4%
18.3%
RMB 19,341
35.9% (at 12%)
RMB 12,143
30
Guangzhou
28.9%
28.9%
27.6%
18.1%
RMB 19,328
35.9% (at 12%)
RMB 12,158
31
Haikou
28.3%
28.3%
24.2%
14.6%
RMB 19,245
35.3% (at 12%)
RMB 12,097
32
Dongguan
28.2%
28.2%
26.0%
15.7%
RMB 19,230
35.2% (at 12%)
RMB 12,158
33
Hefei
28.1%
28.1%
21.8%
13.1%
RMB 19,215
35.1% (at 12%)
RMB 12,118
34
Jiangmen
28.0%
28.0%
26.3%
18.2%
RMB 19,200
35.0% (at 12%)
RMB 12,158
35
Zhuhai
28.0%
28.0%
26.2%
16.5%
RMB 19,200
35.0% (at 12%)
RMB 12,226
36
Zhongshan
27.8%
27.8%
26.4%
18.2%
RMB 19,170
34.8% (at 12%)
RMB 12,158
37
Huizhou
27.7%
27.6%
24.9%
15.2%
RMB 19,147
34.6% (at 12%)
RMB 12,158
38
Foshan
27.5%
25.5%
22.5%
13.7%
RMB 18,831
32.5% (at 12%)
RMB 12,254
In Kunming, Xi’an and Huizhou the load at RMB 8,000 is slightly higher than at RMB 15,000 because one component is a fixed monthly amount rather than a percentage of salary. In Foshan the load at RMB 8,000 is two points higher than at RMB 15,000, because employer medical and maternity insurance are charged on a base capped at RMB 9,660.
The load falls because contributions are charged only up to a maximum contribution base, which each city sets and usually ties to the local average wage. Once a salary passes that base, the contribution stops growing in RMB and so shrinks as a percentage. Cities with lower average wages have lower caps, which is why a RMB 50,000 salary carries a 13% load in Zhengzhou and a 23% load in Shanghai.
Method
Source. The Out2China employment cost calculator, using the contribution rates and bases it holds for each city for policy month October 2026. Where no current official notice was found, the most recent published value is carried forward.
What is included. Employer contributions to pension, medical, unemployment, work injury and maternity insurance where charged, plus the housing provident fund.
Salary levels. RMB 8,000, 15,000, 30,000 and 50,000 gross per month, with the entered salary used as the contribution wage.
Housing fund. 5% on each side as the base case. The last load column uses the highest rate the calculator allows for that city.
Work injury rate. The ordinary office rate for each city, between 0.16% and 0.6%.
Tianjin. Unemployment insurance is included at 0.5% for the employer and 0.5% for the employee. The most recent notice we found (Jin Ren She Ban Fa [2024] No. 37, read in republished form, not on the bureau’s own site) runs to 31 December 2025; we have not located a 2026 notice and have carried the rate forward.
Foshan. Employer medical insurance (4.5%) and maternity insurance (1%) are charged on a contribution base capped at RMB 9,660, the ceiling set by the official 2026 notice (Fo Yi Bao [2025] No. 69, in Chinese). The notice states the ceiling straight after defining the employer and employee bases and does not limit it to the employee share, but we have not found an official statement explicitly confirming that it applies to the employer share. If the ceiling did not apply to the employer share, Foshan's load would be about 27.5% at RMB 15,000 and 18.2% at RMB 50,000. When first published on 14 November 2026, this report used those higher figures; it was revised the same day.
Shenzhen. Calculated for an employee with local household registration (Tier 1 medical), which includes a 1% local pension supplement. For an employee without local registration the load at RMB 15,000 is about 28.5%.
Take-home pay. Gross salary less employee contributions and estimated individual income tax for a China tax resident with the RMB 5,000 monthly standard deduction and no other deductions.
Limits of this data
These are budget estimates, not official statistics. For 37 of the 38 cities the calculator labels the result a reference budget: some components use published values that have not yet been confirmed against the current official notice. Only Beijing’s components are marked as reviewed.
Actual contribution bases can differ from the entered salary, and collection rounding differs by city.
Service fees, recruitment costs, bonuses, a 13th-month salary and benefits beyond the statutory minimum are not included.
Rates and bases change, usually mid-year. This benchmark reflects October 2026.
Official sources by city
These are the government documents that the calculator cites for each city. Listing a document does not mean every item for that city has been checked against it. As set out in “Limits of this data”, for 37 of the 38 cities the calculator labels the result a reference budget. Only Beijing’s components are marked as reviewed. Each document covers only the items it names.
Shaoxing Municipal People’s Government · Shaoxing Healthcare Security Measures (Shao Zheng Fa [2024] No. 17) (2024) (no link: the page could not be opened when checked on 17 November 2026)
Zhejiang Department of Human Resources and Social Security: policy interpretation of the 2026 social insurance contribution bases (no link: the page could not be opened when checked on 17 November 2026)
Zhejiang Department of Human Resources and Social Security: policy interpretation of the 2026 social insurance contribution bases (no link: the page could not be opened when checked on 17 November 2026)
Zhengzhou · 3 documents
Henan Provincial Tax Service · Announcement on employer reporting of social-insurance wages for the 2026 contribution year (2026) (no link: the page could not be opened when checked on 17 November 2026)
Henan notice on the 2026 upper and lower limits of social insurance contribution bases (no link: the page could not be opened when checked on 17 November 2026)
Hunan Provincial Human Resources and Social Security Department · Announcement disclosing 2025 social-insurance information (2026) (no link: the page could not be opened when checked on 17 November 2026)
Changsha 2026 housing-fund base adjustment (Changsha municipal government portal) (no link: the page could not be opened when checked on 17 November 2026)
Wenzhou Housing Fund: 2026 contribution adjustment and rounding rules (no link: the page could not be opened when checked on 17 November 2026)
Zhejiang Department of Human Resources and Social Security: policy interpretation of the 2026 social insurance contribution bases (no link: the page could not be opened when checked on 17 November 2026)
Zhejiang Department of Human Resources and Social Security: policy interpretation of the 2026 social insurance contribution bases (no link: the page could not be opened when checked on 17 November 2026)
Jiaxing housing fund: 2026 contribution base adjustment notice and filing guide (no link: the page could not be opened when checked on 17 November 2026)
Yiwu Municipal People’s Government · Implementation opinions on the Jinhua Basic Medical Insurance Measures (Yi Zheng Fa [2018] No. 107) (2018) (no link: the page could not be opened when checked on 17 November 2026)
Zhejiang Department of Human Resources and Social Security: policy interpretation of the 2026 social insurance contribution bases (no link: the page could not be opened when checked on 17 November 2026)
Kunming Municipal Healthcare Security Bureau and Finance Bureau · Notice further standardizing implementation of employee maternity insurance policy in Kunming (2024) (no link: the page could not be opened when checked on 17 November 2026)
Kunming Housing Provident Fund Management Center · Notice on Kunming’s 2026 housing-fund contribution bases and ratios (2026) (no link: the page could not be opened when checked on 17 November 2026)
Ningbo · 3 documents
Ningbo Municipal Housing and Urban-Rural Development Bureau · Supplementary notice on the 2026 housing-fund contribution-base adjustment (2026) (no link: the page could not be opened when checked on 17 November 2026)
Zhejiang Department of Human Resources and Social Security: policy interpretation of the 2026 social insurance contribution bases (no link: the page could not be opened when checked on 17 November 2026)
Chengdu · 1 document
Sichuan Provincial Human Resources and Social Security Department · Notice announcing 2026 provincial social-insurance base limits and related parameters (2026) (no link: the page could not be opened when checked on 17 November 2026)
Xiamen Healthcare Security Bureau, Finance Bureau and Xiamen Tax Service · Announcement specifying 2026 employee basic medical insurance rates (2025) (no link: the page could not be opened when checked on 17 November 2026)
Xiamen Housing Provident Fund Center · Notice on the 2026 housing-fund contribution-base and ratio adjustment (2026) (no link: the page could not be opened when checked on 17 November 2026)
Weihai Municipal Human Resources and Social Security Bureau · Notice forwarding the Shandong four-authority notice on 2025 social-insurance bases (2025) (no link: the page could not be opened when checked on 17 November 2026)
Shandong 2026 social insurance base notice (Lu Ren She Zi [2026] No. 75) (no link: the page could not be opened when checked on 17 November 2026)
Jinan · 2 documents
Weihai Municipal Human Resources and Social Security Bureau · Notice forwarding the Shandong four-authority notice on 2025 social-insurance bases (2025) (no link: the page could not be opened when checked on 17 November 2026)
Shandong 2026 social insurance base notice (Lu Ren She Zi [2026] No. 75) (no link: the page could not be opened when checked on 17 November 2026)
Shandong 2026 social insurance base notice (Lu Ren She Zi [2026] No. 75) (no link: the page could not be opened when checked on 17 November 2026)
Weihai · 2 documents
Weihai Municipal Human Resources and Social Security Bureau · Notice forwarding the Shandong four-authority notice on 2025 social-insurance bases (2025) (no link: the page could not be opened when checked on 17 November 2026)
Shandong 2026 social insurance base notice (Lu Ren She Zi [2026] No. 75) (no link: the page could not be opened when checked on 17 November 2026)
Weifang · 2 documents
Weihai Municipal Human Resources and Social Security Bureau · Notice forwarding the Shandong four-authority notice on 2025 social-insurance bases (2025) (no link: the page could not be opened when checked on 17 November 2026)
Shandong 2026 social insurance base notice (Lu Ren She Zi [2026] No. 75) (no link: the page could not be opened when checked on 17 November 2026)
Fuzhou Municipal Healthcare Security Bureau · Notice adjusting Fuzhou’s 2026 employee medical insurance base limits (2026) (no link: the page could not be opened when checked on 17 November 2026)
Shenzhen Municipal People’s Government · Shenzhen Healthcare Security Measures (Municipal Government Order No. 358) (2023) (no link: the page could not be opened when checked on 17 November 2026)
Standing Committee of the Shenzhen Municipal People’s Congress · Shenzhen Special Economic Zone Social Pension Insurance Regulations, 2021 revision (2021) (no link: the page could not be opened when checked on 17 November 2026)
Shenzhen Housing Provident Fund Management Center · What contribution-base adjustments apply to employees from 1 July 2026 to 30 June 2027? (2026) (no link: the page could not be opened when checked on 17 November 2026)
Shenzhen Housing Provident Fund Management Center · Does the housing-fund minimum base change for new employees from 1 September 2026? (2026) (no link: the page could not be opened when checked on 17 November 2026)
Shaanxi Human Resources and Social Security: 2026 notice on pension, unemployment and work-injury contribution bases (no link: the page could not be opened when checked on 17 November 2026)
Guangzhou · 3 documents
Guangzhou Housing Provident Fund Management Center · Notice on the 2026 housing-fund contribution adjustment (2026) (no link: the page could not be opened when checked on 17 November 2026)
Guangzhou Housing Provident Fund Management Center · Notice adjusting the minimum housing-fund contribution base (2026) (no link: the page could not be opened when checked on 17 November 2026)
Hainan Provincial Housing Provident Fund Administration · Announcement of the 2026 housing-fund contribution-base range (2026) (no link: the page could not be opened when checked on 17 November 2026)
Hainan Human Resources and Social Security: 2026 contribution wage bases (no link: the page could not be opened when checked on 17 November 2026)
Foshan Housing Provident Fund Center: 2026 notice (no link: the page could not be opened when checked on 17 November 2026)
Update log
14 November 2026 First published.
14 November 2026 Foshan: employer medical and maternity contributions changed to the capped basis. The Foshan figures, the ranges that depend on them and the data file were updated the same day.
19 November 2026 Added the list of official sources by city and this update log. No figures changed.
Frequently asked questions
How much does an employer pay on top of salary in China?
For an employee on RMB 15,000 a month, employer social insurance and housing fund add between 25.5% and 32.2% of gross salary across 38 cities, with the housing fund at the 5% minimum. The median is 29.9%. A higher housing fund rate raises the figure, up to about 39% at 12%.
Which Chinese city has the lowest employer social insurance cost?
Among the 38 cities in this benchmark, Foshan is lowest at 25.5% of a RMB 15,000 salary. Huizhou, Zhongshan, Zhuhai, Jiangmen and Dongguan, all in Guangdong, and Hefei are between 27.6% and 28.2%. For a RMB 50,000 salary the lowest are Zhengzhou and Hefei at 13.1%, because their contribution caps are lower.
Why is the employer cost percentage lower for high salaries in China?
Contributions are charged only up to a maximum contribution base that each city sets, usually linked to the local average wage. Above that base the amount in RMB stops rising, so it falls as a share of salary. At RMB 50,000 the employer load ranges from 13.1% to 23.2% depending on the city.
Does the housing fund rate change the employer cost in China?
Yes. At a RMB 15,000 salary it changes the cost by more than the choice of city. Employers can usually choose a housing fund rate between 5% and 12%, matched by the employee. Moving from 5% to 12% adds seven percentage points to the employer load in every city that allows 12%. Shanghai's maximum in this model is 7%.
Cite this data
You are welcome to quote these figures with a link to this page.Source: Out2China, China Employer Cost by City 2026. https://out2china.com/china-employer-cost-by-city-2026/
Get the right next step for your China operations
Tell us where you are today and we'll reply within one business day with the next step that fits your situation.